Fructose Production Cost Analysis Report 2025 Edition: Industry Trends, Capital Investment, Price Trends, Manufacturing Process, Raw Materials Requirement, Operating Cost, and Revenue Statistics
Report Overview:
The report by Syndicated Analytics, titled “Fructose Production Cost Analysis Report 2025 Edition: Industry Trends, Capital Investment, Price Trend, Manufacturing Process, Raw Materials Requirement, Operating Cost, and Revenue Statistics,” presents an exhaustive analysis of both the operational expenses and revenue projections for setting up an fructose manufacturing facility. Resulting from thorough primary and secondary research efforts, this document offers an in-depth exploration of market dynamics and the effects of the COVID-19 pandemic at both global and regional scales. The study meticulously examines price fluctuations, the balance of mass against required raw materials, and the critical unit operations essential to the fructose production process. A detailed assessment of capital expenditures is provided, encompassing the breakdown of expenses related to raw materials, utilities, labor, packaging, transport, land acquisition, construction, and equipment. Additionally, the report forecasts profit margins and suggests strategies for setting optimal product prices. For those considering entering the fructose market or current stakeholders, this report serves as a vital tool.
Introduction
Fructose refers to a sweetener that is extensively used as a substitute for table sugar in the food and beverage (F&B) sector. It is extracted in both liquids and crystalline forms from various fruits and tuberous vegetables, such as potatoes and onions, through hydrolyzation of starch to glucose. It is a dietary monosaccharide that is absorbed directly into the bloodstream during the procedure of digestion. In recent years, fructose has gained momentum as it is characterized by low-calorie content and forms an essential ingredient in the production of various baked goods to enrich their texture, aroma, and quality.
Market Trends/Drivers
One of the primary factors driving the market is the increasing demand for low-calorie sweeteners globally. Additionally, the rising health consciousness among the masses in confluence with the growing need to maintain a healthy lifestyle is creating a positive market outlook. Other than this, the rising number of individuals diagnosed with diabetes globally is leading to a growing preference for fructose on account of its low Glycemic Index (GI). Consequently, fructose is widely utilized as an essential ingredient in the preparation of various flavored yogurt, energy drinks, nutritional bars, confectionaries and juice concentrates. Besides this, the augmenting demand for healthy processed food with low calories, is positively influencing the market growth. In line with this, the shifting dietary preferences of the masses, along with rapid urbanization and exponential growth in the food and beverage (F&B) industry, have escalated the product demand. Apart from these factors, the rising utilization of fructose as an essential ingredient in the production of nutritional bars, energy drinks, flavored yogurt, confectionaries, and juice concentrates is creating lucrative growth opportunities for key players operating in the industry. Furthermore, the easy availability of various processed foods containing fructose across online and offline retail channels and the expanding disposable income levels represent other growth-inducing factors.
This production cost analysis report by Syndicated Analytics is the result of a comprehensive examination of the fructose manufacturing process. The study covers all the requisite aspects that one needs to know while making a foray into the fructose industry. It is based on the latest economic data and presents exhaustive insights about the primary process flow, raw material requirements, reactions involved, utility costs, operating costs, capital investments, pricing, margins, etc. This report is a must-read for entrepreneurs, investors, researchers, consultants, business strategists, and all those who have any kind of stake in the fructose industry.
Market Analysis
This section delves into the dynamics of the fructose market, including overview, historical and current performance, and impact of COVID-19. It examines factors driving demand, identifies key market trends, and analyzes the price trend. This analysis provides stakeholders with critical insights into market opportunities and challenges.
| Market Overview | Provides a broad introduction to the fructose market, including its definition, applications, and the role it plays in various industries. |
| Historical and Current Market Performance | Examines the market's development over time, highlighting trends, growth patterns, and significant changes in the market landscape. |
| Impact of COVID-19 | Analyzes the effects of the global pandemic on the fructose market, including disruptions in supply chains, changes in demand, and long-term implications. |
| Market Forecast | Projects the future trajectory of the market based on current data, trends, and potential future developments. |
| Market Breakup by Segment | Segments the market based on product types, applications, or other relevant criteria, providing detailed insights into each segment's performance and prospects. |
| Market Breakup by Region | Discusses the market's geographical distribution, analyzing key regions and countries in terms of market size, growth opportunities, and challenges. |
| Price Trend | Fructose Price Trend: Examines the historical, current, and forecasted price trend of fructose. Product Margins: Discusses the profitability and margins associated with fructose production and sales. |
Fructose Manufacturing Process
The manufacturing process segment offers a detailed overview of the production of fructose, highlighting the technological methodologies employed, from raw material procurement to the final product. It outlines the sequence of operations involved and the equipment used, offering a comprehensive understanding of the manufacturing lifecycle.
| Product Overview | This section introduces fructose, outlining its properties, applications, and significance in various industries. The overview establishes a foundational understanding of the product's role and value in the market. |
| Detailed Process Flow | A comprehensive depiction of the fructose manufacturing process, from raw material intake to final product packaging, is provided. This includes a step-by-step guide through each stage of production, emphasizing critical control points and technological considerations. |
| Various Types of Unit Operations Involved | An examination of the unit operations integral to the manufacturing process. This segment delves into the technical aspects of each operation, detailing the equipment and methodologies employed. |
| Mass Balance and Raw Material Requirements | An analysis of the mass balance within the production process, highlighting the input of raw materials and output of final products and by-products. This section quantifies the raw materials required for a defined production volume, facilitating resource planning and optimization. |
Production Cost Analysis
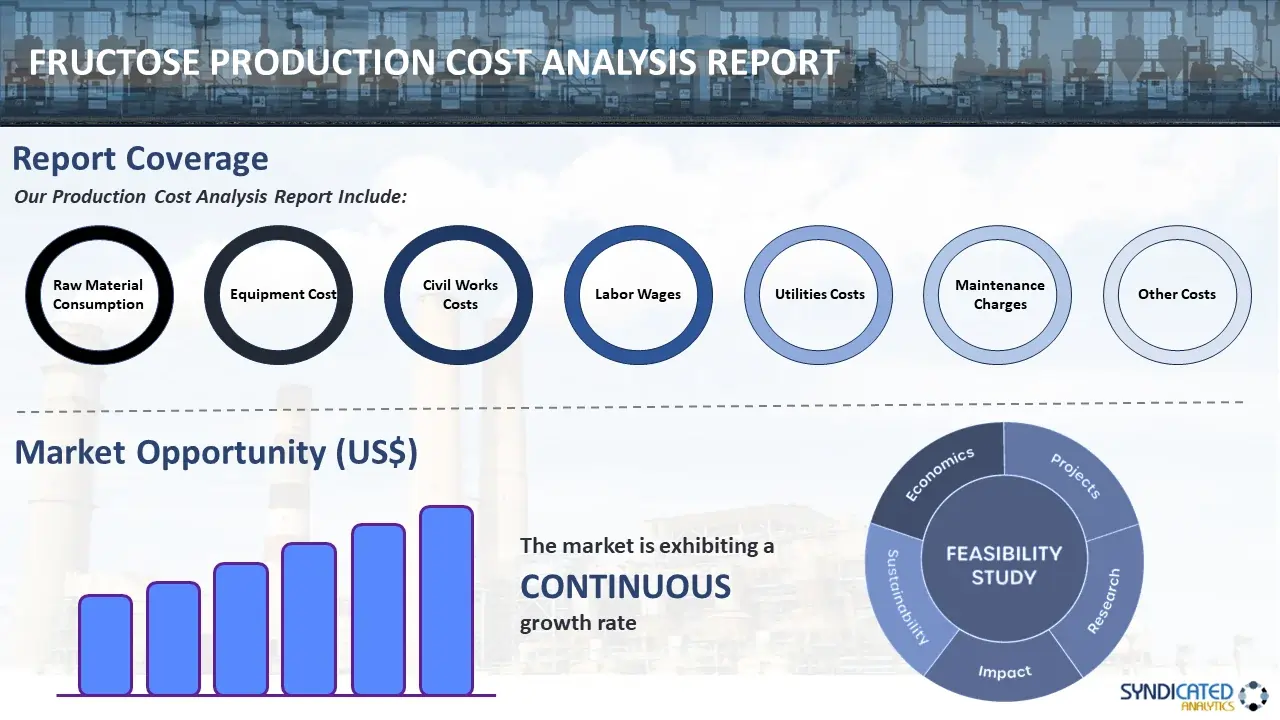
This part of the report scrutinizes the various costs associated with the production of fructose, including raw material costs, utilities, labor, and overheads. It breaks down the plant costs into detailed categories, providing an in-depth look at the factors contributing to the total production cost and their implications on pricing and profitability.
| Currency | US$ (Information can also be provided in the local currency) |
| Pricing and Purchase Options | Single User License: US$ 3450 Five User License: US$ 4450 Corporate User License: US$ 5450 |
| Customization Scope | The report can also be customized based on the requirement of the customer |
| Post-Sale Analyst Support | 12-14 Weeks |
| Delivery Format | PDF and Excel through email (We can also provide the editable version of the report in PPT/Word format on special request) |
Key Questions Answered in This Report?
- What are the various unit operations involved in manufacturing fructose?
- What are the raw material requirements and costs in manufacturing fructose?
- What are the utility requirements and costs in manufacturing fructose?
- What are the manpower requirements and costs in manufacturing fructose?
- What are the packaging requirements and costs in manufacturing fructose?
- What are the transportation requirements and costs in manufacturing fructose?
- What are the land requirements and costs in manufacturing fructose?
- What are the construction requirements and costs in manufacturing fructose?
- What are the profit margins in fructose?
- What should be the pricing mechanism of fructose?
Seeking a Tailored Project Report?
While we have endeavored to create a comprehensive report, we acknowledge that each stakeholder may possess unique requirements. In light of this, we offer the option to customize the report to align with your specific needs. You can convey your business specifications to our consultants, and we will furnish you with a personalized scope tailored precisely to your requirements. Some of the common customizations that our clients often request include:
- Tailoring the report to suit the country/region where you intend to establish your plant.
- Adapting the manufacturing capacity of the plant to meet your specific needs.
- Customizing machinery suppliers and costs to align with your requirements.
- Incorporating any additional elements into the existing scope as per your specifications.
Why Choose Syndicated Analytics:
- Our reports offer valuable insights to stakeholders, enabling them to make informed business decisions confidently.
- We maintain a robust network of consultants and domain experts spanning over 100 countries across North America, Europe, Asia Pacific, South America, Africa, and the Middle East.
- Our extensive database includes equipment and raw material suppliers from major continents, ensuring comprehensive coverage.
- We diligently track and update critical factors such as land costs, construction costs, utility expenses, labor costs, and more, across more than 100 countries worldwide.
- Syndicated Analytics is the trusted partner of choice for leading corporations, governments, and institutions globally. Our clientele ranges from small startups to Fortune 500 companies.
- Our dedicated in-house team comprises experts in various fields, including engineers, statisticians, modeling specialists, chartered accountants, architects, and more. They play a pivotal role in developing, expanding, and optimizing sustainable manufacturing facilities worldwide.
Purchase Options
Ask For Customization
Personalize this research
Triangulate with your own data
Get data as per your format and definition
Gain a deeper dive on a specific application, geography, customer or competitor
Any level of personalization
Get in Touch
Call us on
US: +1-213-316-7435
Uk: +44-20-8040-3201
Drop us an email at
sales@syndicatedanalytics.com