
Rebar Production Cost Analysis Report 2025 Edition: Industry Trends, Capital Investment, Price Trends, Manufacturing Process, Raw Materials Requirement, Operating Cost, and Revenue Statistics
Report Overview:
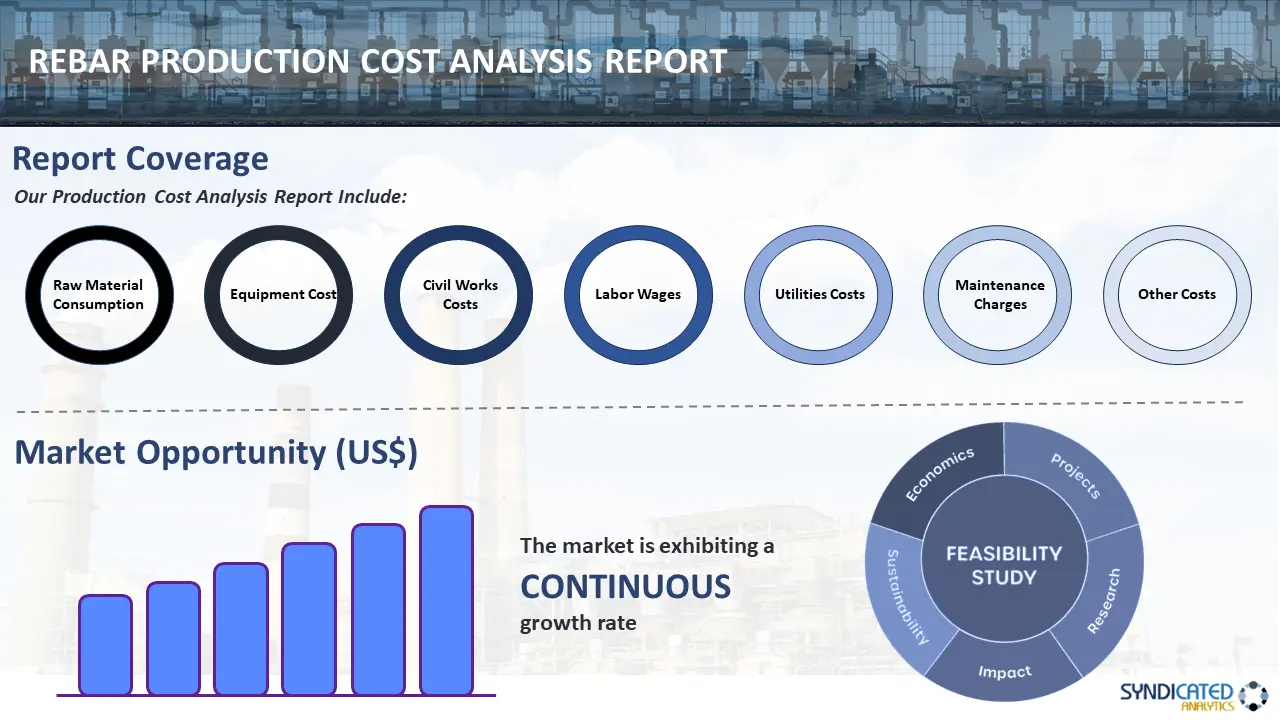
The report by Syndicated Analytics, titled “Rebar Production Cost Analysis Report 2025 Edition: Industry Trends, Capital Investment, Price Trends, Manufacturing Process, Raw Materials Requirement, Operating Cost, and Revenue Statistics ,” offers a comprehensive examination of the operating costs and revenue statistics associated with establishing an rebar plant. It is the culmination of extensive primary and secondary research, encompassing a detailed analysis of market trends and the impact of COVID-19 on both global and regional levels. Additionally, it provides profiles of key industry players. The report also delves into price trends, mass balance required raw materials, and the various unit operations integral to the rebar manufacturing process. It includes a comprehensive capital cost analysis while covering the cost breakdown of raw materials, utilities, labor, packaging, transportation, land and construction, and machinery. The study also presents projected profit margins and recommends optimal product pricing strategies. For individuals contemplating entry into the rebar industry or those with vested interests, this report is an essential resource.
A rebar is a steel bar or mesh used in masonry structures and concrete construction to improve tensile strength. It includes epoxy-coated, galvanized, mild, deformed, carbon, and stainless steel rebars as standard variants. It is commonly available in various forms, such as round, square-twisted, ribbed, and stretched. Rebar is widely used to construct high-rise buildings, parking ramps, concrete piers, foundations, roads, and driveways. It supports structures and exhibits high strength, ductility, modulus of elasticity, and impact resistance. Rebar is also recyclable, readily available, easy to assemble, and can be bent into the required shape or size.
The significant growth in the construction industry across the globe is creating a positive outlook for the market. Rebar is widely used in constructing skyscrapers, residential buildings, homes, swimming pools, patios, and garages due to its enhanced compatibility with concrete that provides reinforcement, resistance to failure, and more robust support than conventional materials, such as fiberglass and steel wires. Furthermore, increasing investments by several governments in infrastructural development activities, such as roads, highways, airports, railway stations, bridges, stadiums, and multi-story parking facilities, are providing a considerable boost to the market growth. Additionally, the rising adoption of sustainable manufacturing processes that lower environmental impact, reduce carbon dioxide emissions, minimize energy consumption, increase recycling, and contribute to green building performance is facilitating the market growth. Apart from this, the recent development of glass fiber reinforced polymer (GFRP) rebar, which is lightweight, corrosion resistant, non-conductive, environmental-friendly, and provides higher tensile strength, is positively influencing the market growth. Moreover, the widespread product utilization to create art pieces and sculptures, due to its extreme versatility, easy welding, and rustic look, is providing an impetus to the market growth. Other factors, including rapid industrialization, extensive research and development (R&D) activities to improve product quality, and rising product demand for manufacturing tools, door handles, gates, and tables, are anticipated to drive market growth.
This production cost analysis report by Syndicated Analytics is the result of a comprehensive examination of the rebar manufacturing process. The study covers all the requisite aspects that one needs to know while making a foray into the rebar industry. It is based on the latest economic data and presents exhaustive insights about the primary process flow, raw material requirements, reactions involved, utility costs, operating costs, capital investments, pricing, margins, etc. This report is a must-read for entrepreneurs, investors, researchers, consultants, business strategists, and all those who have any kind of stake in the rebar industry.
The following technical and economic aspects are included in the report:
- Market Trends
- Impact of COVID-19
- Major Regions
- Key Manufacturers
- Price Trends
- Mass Balance and Raw Material Requirements
- Various Types of Unit Operations Involved
- Raw Material Costs
- Utility Costs
- Labor Costs
- Packaging Costs
- Transportation Costs
- Land and Construction Costs
- Machinery Costs
- Profit Margins
- Product Pricing
Key Questions Answered in This Report-
- What are the various unit operations involved in manufacturing rebar?
- What are the raw material requirements and costs in manufacturing rebar?
- What are the utility requirements and costs in manufacturing rebar?
- What are the manpower requirements and costs in manufacturing rebar?
- What are the packaging requirements and costs in manufacturing rebar?
- What are the transportation requirements and costs in manufacturing rebar?
- What are the land requirements and costs in manufacturing rebar?
- What are the construction requirements and costs in manufacturing rebar?
- What are the profit margins in rebar?
- What should be the pricing mechanism of rebar?
Need a Customized Project Report?
Although we have tried to make the report as comprehensive as possible, we believe that every stakeholder may have their specific requirements. In view of this, we can customize the report based on your particular needs. You can share your business requirements with our consultants, and we will provide you a tailored scope. Some of the common customizations that our clients request us include:
- The report can be customized based on the country/region that you plan to set up your plant.
- The manufacturing capacity of the plant can be customized based on your requirements.
- Machinery suppliers and costs can be customized based on your requirements.
- Any additions to the current scope can also be provided based on your requirements.
Why buy Syndicated Analytics reports
- Our reports provide stakeholders insights into the viability of a business venture, allowing them to make informed business decisions.
- We have a strong network of consultants and domain experts in 100+ countries across North America, Europe, Asia Pacific, South America, Africa, and the Middle East.
- We have a strong database of equipment and raw material suppliers across all major continents.
- We regularly track and update land costs, construction costs, utility costs, labor costs, etc. across 100+ countries around the globe.
- We are the trusted business partners of the world’s leading corporates, governments, and institutions. Our client list ranges from small and start-up businesses to Fortune 500 companies.
- Our strong in-house team of engineers, statisticians, modeling experts, charted accountants, architects, etc. have been instrumental in building, expanding, and optimizing sustainable manufacturing plants across the globe.
Purchase Options
Customization
Access Tailored Insights Designed for Your BusinessAccess Tailored Insights Designed for Your Business.
Ask For Customization
Personalize this research
Triangulate with your own data
Get data as per your format and definition
Gain a deeper dive on a specific application, geography, customer or competitor
Any level of personalization
Get in Touch
Call us on
US: +1-631-791-1145
Uk: +44-753-714-6104
Drop us an email at
sales@syndicatedanalytics.com