Table Butter Manufacturing Plant Project Report 2025 Edition
Report Coverage: Industry Analysis (Market Performance, Segments, Price Analysis, Outlook), Detailed Process Flow (Product Overview, Unit Operations, Raw Materials, Quality Assurance), Requirements and Cost (Machinery, Raw Materials, Packaging, Transportation, Utility, Human Resource), Project Economics (Capital Investments, Operating Costs, Profit Projections, Financial Analysis, Revenue), and Investment Opportunities
Report Overview:
Syndicated Analytics report, titled “Table Butter Manufacturing Plant Project Report 2025 Edition: Industry Analysis (Market Performance, Segments, Price Analysis, Outlook), Detailed Process Flow (Product Overview, Unit Operations, Raw Materials, Quality Assurance), Requirements and Cost (Machinery, Raw Materials, Packaging, Transportation, Utility, Human Resource), Project Economics (Capital Investments, Operating Costs, Profit Projections, Financial Analysis, Revenue), and Investment Opportunities ,” provides a complete roadmap for setting up a table butter manufacturing plant. It covers a comprehensive market overview to micro-level information such as unit operations involved, raw material requirements, utility requirements, infrastructure requirements, machinery and technology requirements, manpower requirements, packaging requirements, transportation requirements, etc. The report provides detailed insights into project economics, including capital investments, project funding, operating expenses, income and expenditure projections, fixed costs vs. variable costs, direct and indirect costs, expected ROI and net present value (NPV), profit and loss account, financial analysis, etc. This report is a must-read for entrepreneurs, investors, researchers, consultants, and business strategists with a stake in the table butter industry. It provides an in-depth analysis of the industry's current state and future potential, offering valuable insights for decision-making and strategy development. The report is an indispensable resource that offers a detailed examination of the table butter industry. It is a valuable tool for anyone seeking to establish a foothold in this dynamic sector.

Table butter consists of common salt, carotene or annatto, and diacetyl, which is used for adding color and flavor. The butter is prepared using high quality pasteurized cream that is procured from milk and other milk products. Table butter undergoes several changes in terms of its form, depending on the surrounding temperature. For instance, the butter remains solid under refrigeration, melts into a liquid consistency at a higher temperature, and at room temperature, softens to a spreadable consistency. It is backed with several nutritional benefits, such as calcium, niacin, phosphorus, antioxidants, riboflavin, and vitamins A, B, and E. Consistent and adequate consumption of table butter helps in supporting the heart health, improving the immune function, and protecting the cells against damage caused by free radicals.
Market Trends/Drivers:
The increasing demand for table butter for the preparation of a variety of dishes, such as sauces, bakery products, and fried foods, is one of the key factors primarily driving the market growth. The butter has a creamy and rich taste and is largely used as a condiment on cooked products and spread on toasted products. The rising consumer spending power, increasing awareness regarding the health benefits of table butter, and the availability of premium table butter are other factors providing a significant boost to the market growth. Apart from this, the key players are introducing several product variants, such as unsalted, dairy-free, organic, and goat milk table butter, which is creating a positive outlook for the market further across the globe.
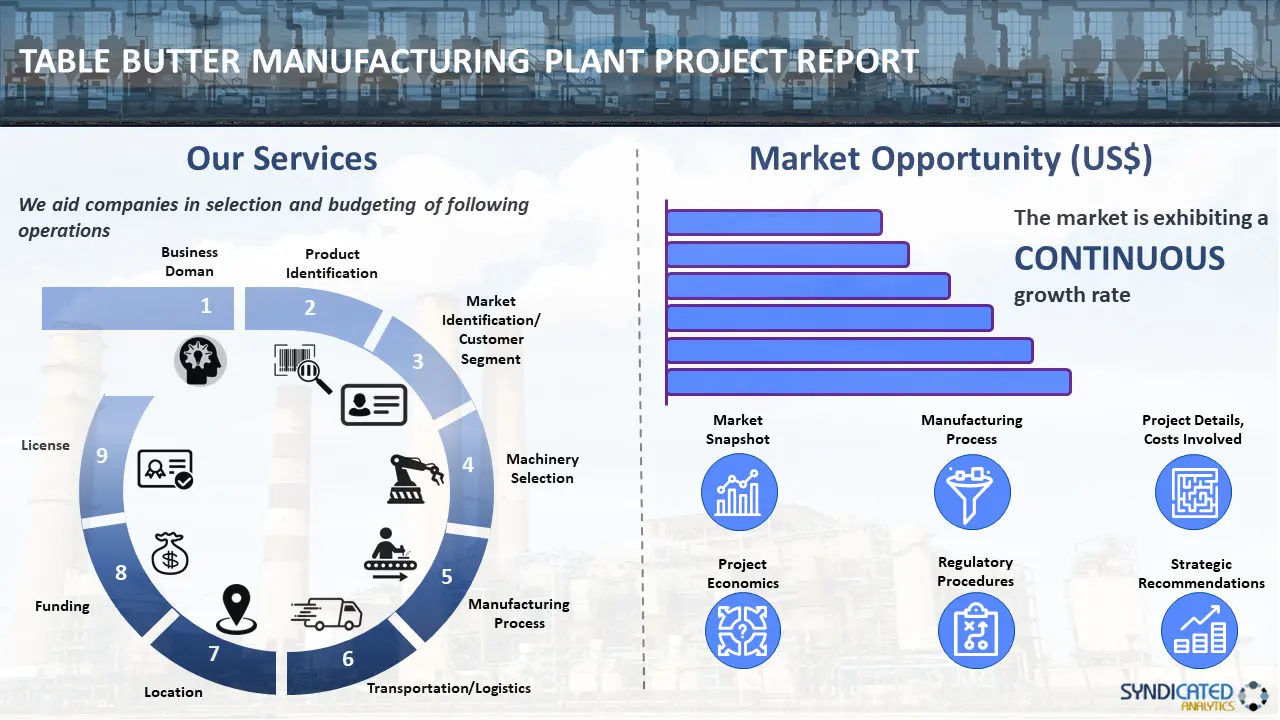
The report provides a techno-commercial roadmap for setting up a table butter manufacturing plant. The study covers all the requisite aspects that one needs to know while making a foray into the table butter industry. This ranges from macro overview of the market to micro details of the industry performance, key success and risk factors, manufacturing requirements, project cost, project economics, expected returns on investment, profit margins, etc. This report is a must-read for entrepreneurs, investors, researchers, consultants, business strategists, and all those who have any kind of stake in the table butter industry.
The project report covers the following aspects of the table butter market:
- Market Snapshot:
- Market Performance
- Market Breakup by Segment
- Market Breakup by Region
- Price Trends
- Impact of COVID-19
- Market Outlook
- Manufacturing Process:
- Product Overview
- Detailed Process Flow
- Unit Operations Involved
- Mass Balance and Raw Material Requirements
- Project Details, Requirements and Costs Involved:
- Land, Location and Site Development
- Plant Layout
- Machinery Requirements and Expenditures
- Raw Material Requirements and Expenditures
- Packaging Requirements and Expenditures
- Transportation Requirements and Expenditures
- Utility Requirements and Expenditures
- Manpower Requirements and Expenditures
- Project Economics
- Capital Investments
- Operating Costs
- Expenditure Projections
- Revenue Projections
- Profit Projections
- Financial Analysis
- Regulatory Procedures and Approval
- Key Success and Risk Factors
Report Scope:
| Report Features | Details |
|---|---|
| Product Name | Table Butter |
| Report Coverage | Detailed Process Flow: Unit Operations Involved, Quality Assurance Criteria, Technical Tests, Mass Balance, and Raw Material Requirements Land, Location and Site Development: Selection Criteria and Significance, Location Analysis, Project Planning and Phasing of Development, Environmental Impact, Land Requirement and Costs Plant Layout: Importance and Essentials, Layout, Factors Influencing Layout Plant Machinery: Machinery Requirements, Machinery Costs, Machinery Suppliers (Provided on Request) Raw Materials: Raw Material Requirements, Raw Material Details and Procurement, Raw Material Costs, Raw Material Suppliers (Provided on Request) Packaging: Packaging Requirements, Packaging Material Details and Procurement, Packaging Costs, Packaging Material Suppliers (Provided on Request) Other Requirements and Costs: Transportation Requirements and Costs, Utility Requirements and Costs, Energy Requirements and Costs, Water Requirements and Costs, Human Resource Requirements and Costs Project Economics: Capital Costs, Techno-Economic Parameters, Income Projections, Expenditure Projections, Product Pricing and Margins, Taxation, Depreciation Financial Analysis: Liquidity Analysis, Profitability Analysis, Payback Period, Net Present Value, Internal Rate of Return, Profit and Loss Account, Uncertainty Analysis, Sensitivity Analysis, Economic Analysis Other Analysis Covered in The Report: Market Trends and Analysis, Market Segmentation, Market Breakup by Region, Price Trends, Competitive Landscape, Regulatory Landscape, Strategic Recommendations, Case Study of a Successful Venture |
| Currency | US$ (Information can also be provided in the local currency) |
| Pricing and Purchase Options | Single User License: US$ 3450 Five User License: US$ 4450 Corporate User License: US$ 5450 |
| Customization Scope | The report can also be customized based on the requirement of the customer |
| Post-Sale Analyst Support | 12-14 Weeks |
| Delivery Format | PDF and Excel through email (We can also provide the editable version of the report in PPT/Word format on special request) |
Key Questions Answered in This Report?
- What are the key success and risk factors in the table butter industry?
- How has the table butter market performed so far and how will it perform in the coming years?
- What is the structure of the table butter industry and who are the key players?
- What are the various unit operations involved in a table butter manufacturing plant?
- What is the total size of land required for setting up a table butter manufacturing plant?
- What are the machinery requirements for setting up a table butter manufacturing plant?
- What are the raw material requirements for setting up a table butter manufacturing plant?
- What are the utility requirements for setting up a table butter manufacturing plant?
- What are the manpower requirements for setting up a table butter manufacturing plant?
- What are the infrastructure costs for setting up a table butter manufacturing plant?
- What are the capital costs for setting up a table butter manufacturing plant?
- What are the operating costs for setting up a table butter manufacturing plant?
- What should be the pricing mechanism of table butter?
- What will be the income and expenditures for a table butter manufacturing plant?
- What is the time required to break-even?
Need a Customized Project Report?
Although we have tried to make the report as comprehensive as possible, we believe that every stakeholder may have their specific requirements. In view of this, we can customize the report based on your particular needs. You can share your business requirements with our consultants, and we will provide you a tailored scope. Some of the common customizations that our clients request us include:
- The report can be customized based on the country/region that you plan to set up your plant.
- The manufacturing capacity of the plant can be customized based on your requirements.
- Machinery suppliers and costs can be customized based on your requirements.
- Any additions to the current scope can also be provided based on your requirements.
Why buy Syndicated Analytics reports?
- Our reports provide stakeholders insights into the viability of a business venture, allowing them to take informed business decisions.
- We have a strong network of consultants and domain experts in 100+ countries across North America, Europe, Asia Pacific, South America, Africa, and the Middle East.
- We have a strong database of equipment and raw material suppliers across all major continents.
- We regularly track and update land costs, construction costs, Utility costs, labour costs, etc across 100+ countries around the globe
- We are the trusted business partners to the world’s leading corporates, governments, and institutions. Our client list ranges from small and start-up businesses to fortune 500 companies
- Our strong in-house team of engineers, statisticians, modelling experts, charted accountants, architects, etc. have been instrumental in building, expanding, and optimizing sustainable manufacturing plants across the globe.
Purchase Options
Ask For Customization
Personalize this research
Triangulate with your own data
Get data as per your format and definition
Gain a deeper dive on a specific application, geography, customer or competitor
Any level of personalization
Get in Touch
Call us on
US: +1-213-316-7435
Uk: +44-20-8040-3201
Drop us an email at
sales@syndicatedanalytics.com